What really matters is revenue. Still, the cost of spectrum matters in an environment where service provider costs threaten to exceed revenues earned from such spectrum.
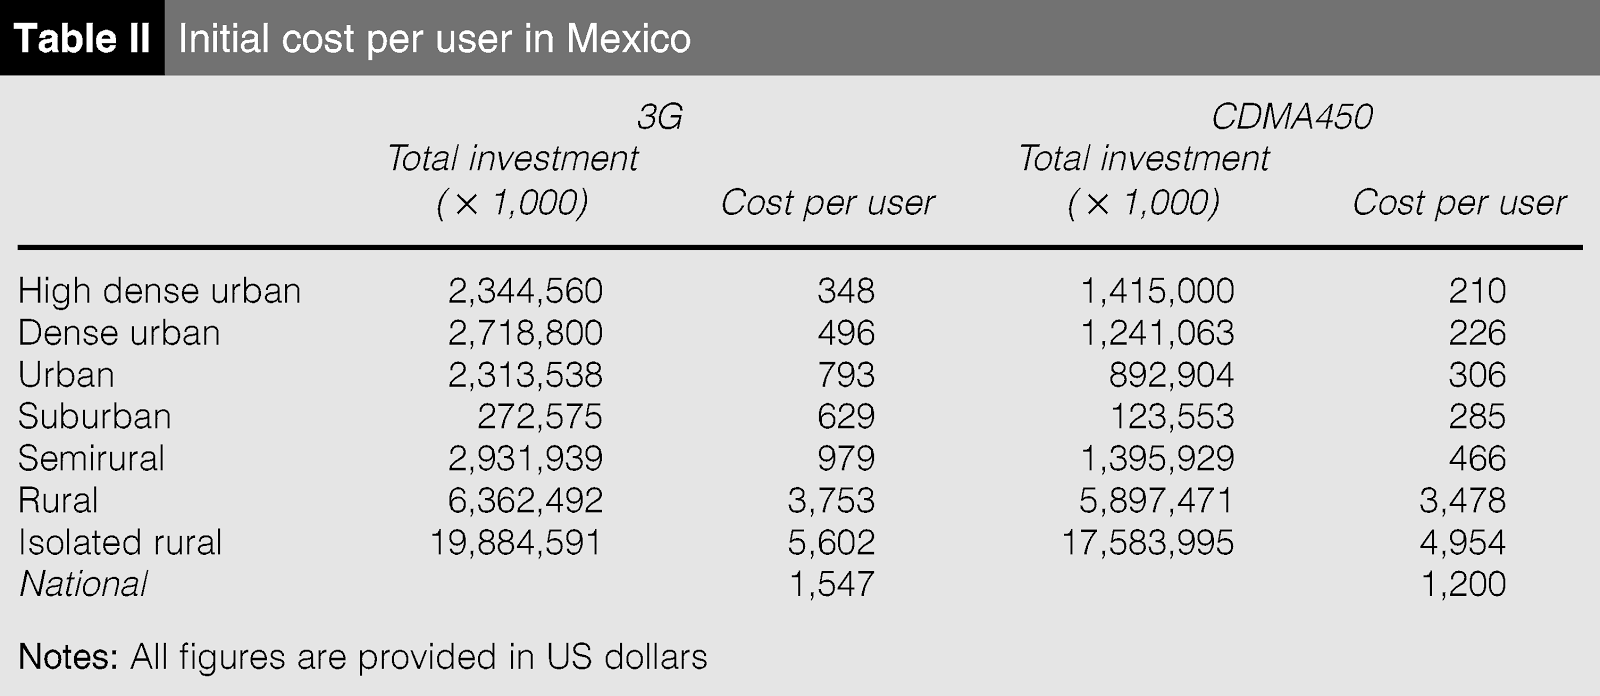
Depending on the country and the population density and terrain, a fully functioning 3G network, for example, might cost between several hundreds of dollars per customer, to a few thousands of dollars per customer.
Spectrum costs are a fraction of that. Assume a service provider has 20 MHz of spectrum in an area of three square miles, paid for whether all of the capacity is being used or not (spectrum reuse is necessary to avoid signal interference).
Assume people reached by signals from that one tower number cover three square miles, where the density is 600 persons per square mile. That implies a population of 5,400 people, each representing 20 MHz per pop. At prices of 10 cents per MHz pop, that works out to $2 per person, or $10,800 in spectrum costs in that area.
At 33 percent market share, implying 1782 paying customers, the cost per customer is about $6 per customer. Even paying interest on such an investment is a small part of the total cost of providing service.
But you can see the sensitivity to price per MHz pop. At $1 a Mhz pop, the spectrum would represent $108,000 in spectrum costs, or $61 per customer. At $4 per MHz pop, spectrum costs would represent $244 per customer.
Amortized over 10 years, with monthly revenue of $50, that still is not unworkable, at reasonable market share. But as with any fixed cost, market share really matters. At 16 percent share, spectrum cost grows to about $488 per customer.
If revenue earned from the leading services sold by mobile service providers is dropping, and if market share is fragmented, the cost impact of spectrum acquisition is magnified.
In that sense, revenue per MHz pop, though not a metric anybody uses, likewise will drop. In the end, that is the key issue: revenue per MHz pop, not cost of spectrum per MHz pop, at a high level.
Whether Long Term Evolution 4G auctions will become a spectrum bubble is anybody’s guess, at the moment. But industry observers with long memories will recall that vast overbidding nearly bankrupted leading European mobile service providers when 3G auctions were held.
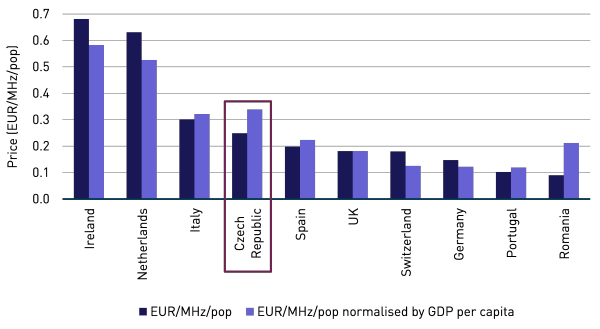
There are some signs of price inflation in the Netherlands, Ireland, Taiwan, in Austria and in the Czech Republic, for example. In Taiwan, bid prices were about three times what regulators set as the minimum price. The Czech Republic suspended its auction when prices grew too quickly.
The U.K. 4G spectrum auctions generally are considered reasonable, compared to Czech prices before the auction suspension. The May 2013 U.K. auction raised around EUR0.18/MHz/pop. The Czech auction had reached EUR0.25/MHz/pop, about 30 percent higher than the actual U.K. prices.
MHz per pop is a way of measuring capacity per person, and cost per megahertz per pop is a way of measuring spectrum cost, per unit of capacity, per person.
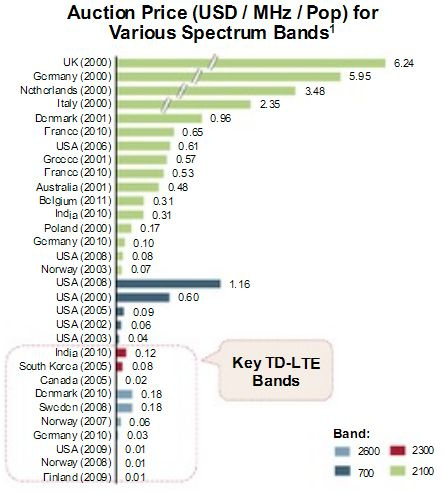
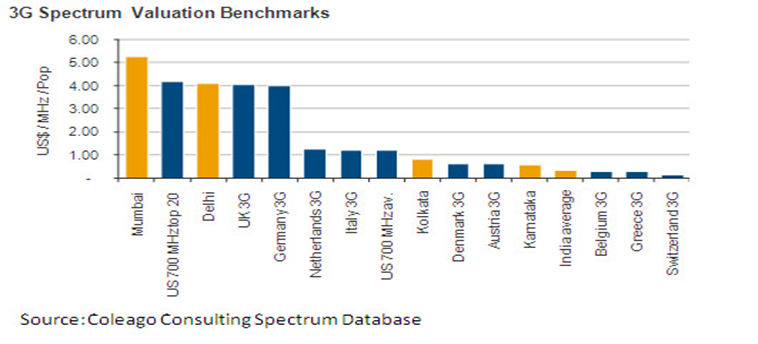
Even that pales in comparison to 3G auction prices in some markets, where past prices have been measured in tenths of cents or cents. In some cases, Western European 3G prices were measured in dollars.
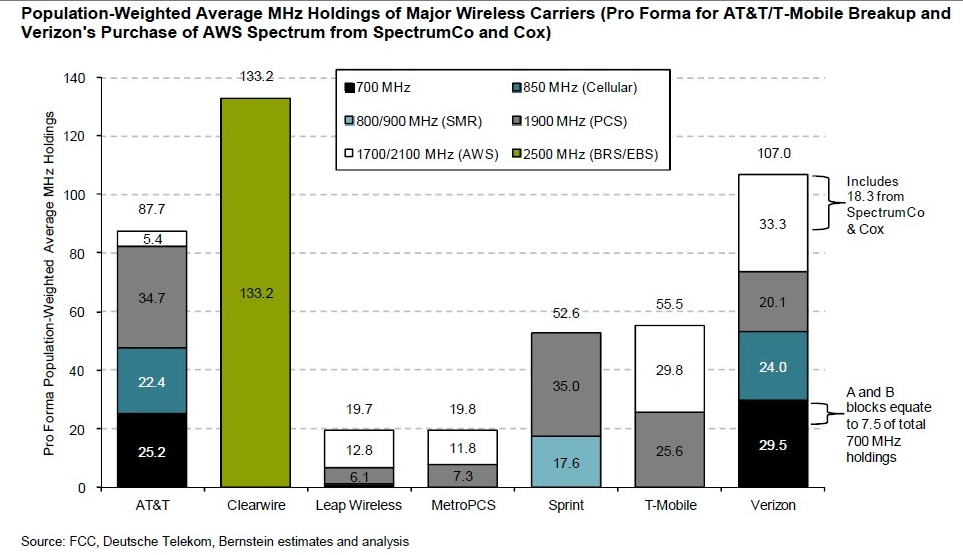
Of course, the “right price” for spectrum hinges on any number of business and market factors. The value of Clearwire spectrum provides a recent example.
Some recent 700-MHz spectrum in the U.S. market has sold for dollars per MHz pop, a “high” price by world standards. But that spectrum also has coverage and wall-penetrating advantages bidders believed justified the price.
Whether spectrum was acquired at prices “too high” can be determined only after the capacity is put into service and revenue generated by that spectrum can be assessed. Prices of dollars per MHz pop might be quite reasonable if the new spectrum allows a service provider to gain customers, raise profit margins or gross revenue, cut churn or create uniqueness.
In other words, 3G prices were an order of magnitude to two orders of magnitude above spectrum prices paid before, or after. To be sure, the value of spectrum generally is affected by the actual frequencies: lower frequencies are more valuable than higher frequencies.
That is a function of signal propagation, not bandwidth potential. Signals at lower frequencies attenuate less, and hence travel further, with better ability to penetrate walls. On the other hand, signals at higher frequencies are capable of providing much more bandwidth, using any specific coding technique.
Still, prices for 3G spectrum awarded in more recent auctions also was measured in the dollars per MHz pop. The 3G auctions in India provide a recent example.
Also, some spectrum, licensed for backhaul applications rather than end user services, generally costs less than spectrum enabling actual end user services.
For example, 3.5 GHz spectrum intended to support fixed wireless access applications, rather than mobile applications, often was sold at prices an order of magnitude less than spectrum for mobile apps.
3.5 GHz Spectrum Band Pricing Examples
Country
|
Band
|
Price of 10 MHz
|
Per MHz-PoP
|
Italy
|
3.5 GHz
|
€ 10,793,651
|
€ 0.0189
|
Germany
|
3.5 GHz
|
€ 4,325,397
|
€ 0.0053
|
UK
|
3.5 GHz
|
£1,750,000
|
£ 0.0030
|
UK
|
3.8 GHz
|
£744,048
|
£ 0.0012
|
Netherlands
|
3.5 GHz
|
€ 500,000
|
€ 0.0030
|
Switzerland
|
3.5 GHz
|
CHF 1,416,667
|
CHF 0.0178
|
Canada
|
3.5 GHz
|
$2,877,402
|
$ 0.0049
|
On the other hand, 2.5 GHz spectrum made recently available in many European countries (and Canada in 2004 and 2005) cost more than 3.5 GHz spectrum, but they are much lower than prices fetched in the 800 MHz spectrum band (which range between € 0.5 – € 0.8 per MHz-PoP in most countries).
2.5 GHz Spectrum Band Pricing Examples
Country
|
Band
|
Price of 10 MHz
|
Per MHz-PoP
|
Sweden
|
2.5 GHz FDD
|
€ 14,867,475
|
€ 0.159
|
France
|
2.5 GHz FDD
|
€ 66,866,394
|
€ 0.106
|
Italy
|
2.5 GHz FDD
|
€ 35,996,667
|
€ 0.059
|
Belgium
|
2.5 GHz FDD
|
€ 5,025,455
|
€ 0.046
|
Belgium
|
2.5 GHz TDD
|
€ 5,002,222
|
€ 0.045
|
Italy
|
2.5 GHz TDD
|
€ 24,678,367
|
€ 0.041
|
Sweden
|
2.5 GHz TDD
|
€ 3,416,868
|
€ 0.037
|
Spain
|
2.5 GHz FDD
|
€ 12,334,753
|
€ 0.027
|
Germany
|
2.5 GHz FDD
|
€ 18,412,643
|
€ 0.023
|
Germany
|
2.5 GHz TDD
|
€ 17,303,600
|
€ 0.021
|
Netherlands
|
2.5 GHz FDD
|
€ 2,627,000
|
€ 0.0012
|
Canada WCS
|
2.3 GHz WCS
|
$ 6,136,598
|
$ 0.018
|
Looking at spectrum pricing in the higher spectrum bands, 2.5 GHz assets typically sell at a discount of up to 92 percent that of 800 MHz spectrum, while 3.5 GHz spectrum sells at around 82 percent discount to that of 2.5 GHz.
3.x GHz Spectrum Band Pricing Examples
Country
|
Band
|
Price of 10 MHz
|
Per MHz-PoP
|
Italy
|
3.5 GHz
|
€ 10,793,651
|
€ 0.0189
|
Germany
|
3.5 GHz
|
€ 4,325,397
|
€ 0.0053
|
UK
|
3.5 GHz
|
£1,750,000
|
£ 0.0030
|
UK
|
3.8 GHz
|
£744,048
|
£ 0.0012
|
Netherlands
|
3.5 GHz
|
€ 500,000
|
€ 0.0030
|
Switzerland
|
3.5 GHz
|
CHF 1,416,667
|
CHF 0.0178
|
Canada
|
3.5 GHz
|
$2,877,402
|
$ 0.0049
|


No comments:
Post a Comment