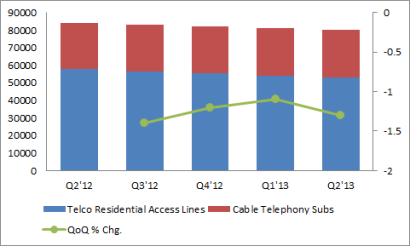
 There’s an interesting point about competitive high speed access markets raised in a new analysis of U.S. high speed access lines, produced by IHS isuppli.
Noting that 80 percent of U.S. households now are connected to the Internet, some 70 percent using high speed access, IHS notes criticisms of the level of competition in the U.S. market.
“For instance, while an overwhelming proportion of the population had broadband Internet access through cable, DSL or fiber, actual uptake by consumers through subscriptions was much less: 40 percent at the end of 2012 for cable, and 23 percent via DSL,” IHS iSuppli notes.
“This means that less than half of U.S. households with access to cable actually subscribed to it, or that only a quarter of the country’s homes able to connect to DSL broadband chose to do so,” IHS notes.
In the monopoly days when voice was the only product sold to consumers, only one provider was lawfully authorized to supply that service and nearly every household bought voice service, there was scarcely a difference between revenue per connection and revenue per connection.
The same could have been said about investment per line and investment per customer. The figures of merit were very closely related.
All that changes in a competitive market.
Consider a simple example where two facilities-based providers compete in a single local market, each getting 50 percent market share of paying customers.
In that scenario, where each provider builds an access network and each garners half the customers, there is a huge difference between revenue and cost per customer, and revenue and cost per connection.
In other words, to serve four homes, if each provider invests $1000 per home, total investment is $8,000 for the four homes, $4,000 spent by each provider.
Under monopoly conditions, total plant investment would have been $4,000.
Assume take rates are 100 percent. That means cost per customer is $2,000 for each home served (the paying customers have to allow the service provider to recover full network investment).
But assume take rates are only 50 percent. Each gets one customer out of four, so network cost per customer grows to $4,000.
Therein lies the danger for all next generation networks: financial returns are highly dependent on the level of competition and customer demand for the products available on the network.
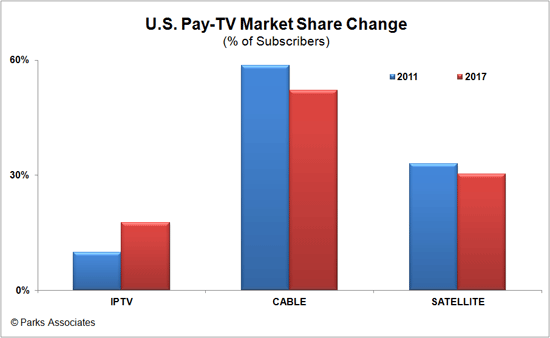
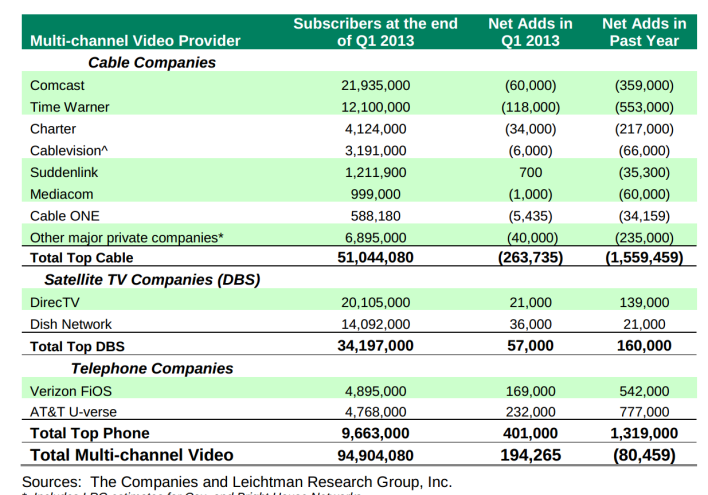
Consider the video subscription business, where cable operators have 54 percent share, satellite providers have 36 percent and telcos have 10 percent.
Roughly speaking, cable’s network has about 50 percent stranded assets, satellite providers have nearly 40 percent stranded assets (though their network makes that less crucial than for a fixed network or terrestrial provider) and telcos have 90 percent stranded assets.
Or, consider fixed network voice services, where about half of U.S. homes actually buy voice services. Telcos have about 66 percent share, while cable TV operators have about 33 percent share.
Of 100 homes built out by both a telco and a cable TV operator, 50 buy voice services. Some 33 out of 100 homes buy voice from the telco and 17 buy voice from the cable operator. That’s an awful lot of stranded investment.
The only reason the fixed network access business still works is that providers are about to sell three or four units of service to the customers they can manage to attract.
Consider a 100-home area where 50 percent of homes buy voice, 70 percent buy high speed access and 90 percent buy video entertainment. Assume satellite is a major competitor only for video.
Assume telcos have 10 pecrent share of video, 66 percent share of voice and 40 percent share of high speed access.
Assume cable TV companies have 54 percent share of video, 33 percent share of voice and 60 percent share of high speed access.
That results in 70 units sold by the telco, 107 units sold by the cable operator and 32 units sold by the satellite providers, in a neighborhood of 100 homes. Overall, cable sells a bit over one service per home (average), while telcos sell one service to 70 percent of homes.
It’s tough to build and make money on that sort of network. In reality, telcos and cable providers do not actually sell one service to each home, but rather two or three services to one home out of three.
Fixed Network Provider Stranded Asset Risk
| |||||||||
Service
|
Households
|
Market Adoption
|
Customer Potential
|
Telco Share
|
Cable Share
|
Satellite Share
|
Telco Accounts
|
Cable Accounts
|
Satellite Accounts
|
Voice
|
100
|
0.5
|
50
|
0.66
|
0.33
|
0
|
33
|
16.5
|
0
|
High Speed Access
|
100
|
0.7
|
70
|
0.4
|
0.6
|
0
|
28
|
42
|
0
|
Video
|
100
|
0.9
|
90
|
0.1
|
0.54
|
0.36
|
9
|
48.6
|
32.4
|
Total Units Sold
|
70
|
107.1
|
32.4
|


No comments:
Post a Comment