Saturday, May 31, 2014

Does Canadian Market Structure Provide Insight on U.S. Mobile Market Consolidation?

For observers trying to ascertain what might happen to competition, investment and innovation in the U.S. mobile market, if the market consolidates to three leading providers, instead of four, Canada provides some data, but probably not so much predictive value.

In Canada, a market many observers think similar enough to the United States to use categories like “North America,” there are three leading mobile providers, where in the U.S. market there are four leading providers.

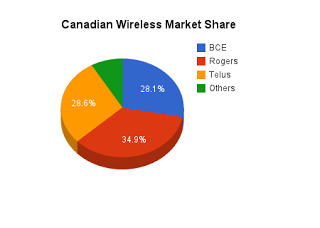
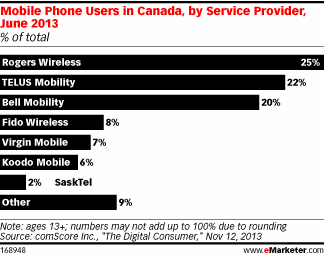
In the fourth quarter of 2013, Rogers Wireless was the largest of Canada’s three primary mobile service providers, with 9.5 million mobile phone subscribers.

Consider the anomaly: in the U.S. market, no entity with strong “cable TV” roots is among the four leaders. Rogers began life as a cable TV operator.

Telus Mobility is second, with 7.81 million subscribers while Bell Mobility follows closely with 7.78 million subscribers. Including the “value” brands also owned by the three leaders, the top three providers control between 88 percent and 91 percent subscriber market share.

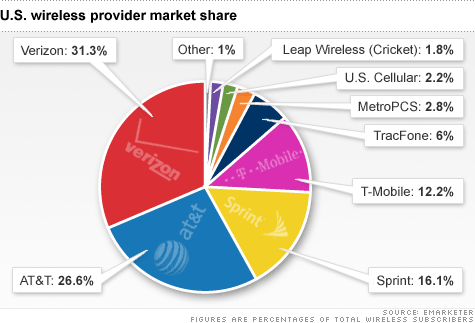
In the U.S. market, the leading four providers control about 86 percent subscriber market share. The top three U.S. providers control about 74 percent subscriber market share. But many believe the U.S. market inevitably will consolidate into a three-firm market at the top.

That might lead to a conclusion that U.S. market trends will converge on the Canadian model, in terms of prices, innovation and investment.

Many observers note that Canadian mobile prices are high, perhaps higher than in the United States, depending on which plans and features are measured. Based on Organization for Economic Cooperation and Development data, Canadian mobile prices are among the highest in the world.

With the caveat that comparing prices across nations and regions always is difficult, it might be accurate to say that Canadian prices are better than U.S. prices on the lower end, while U.S. plans tend to be better on the higher end (smartphone packages with lots of Internet data).

That might be the point. Either three or four providers might do about the same in terms of sustaining competition for feature phone service and plans. But four providers might be better for sustaining high end, smartphone and mobile Internet access plans.

J.D. Power and Associates in May 2013 reported that more than half of mobile users in Canada did not have a data plan in March 2013, likely due to high prices. On the other hand, the market might already be changing.

J.D. Power’s “2014 Canadian Wireless Total Ownership Experience Study” showed an average drop of CA$7 (around $6.80) on monthly wireless bills, the result of a new operating environment perhaps shaped by rules related to contract terms.

In December 2013, the Canadian Radio-television and Telecommunications Commission put restrictions on operator ability to impose three-year contracts and capped roaming and mobile Internet access prices.

Specifically, the new rules enabled consumers to break their contract without cancellation fees after two years and capped operator charges for data and roaming.


Also, eMarketer argues that less competition has lead to slower introduction of Long Term Evolution 4G services, compared to the U.S. market.


But the U.S. and Canadian markets are different in some key ways. For starters, the U.S. now is seen as a global leader in Long Term Evolution deployment, device innovation, use of Internet apps and processes, as well as software innovation.

Whether there are three or four leading mobile providers will not affect those other important trends.

Also, new competitors also are lining up to enter the market, unlike the Canadian case. Dish Network and some consortium of U.S. cable operators, lead by Comcast, are expected.

In other words, Canada’s current market structure likely does not represent what might happen in the U.S. market, if consolidation happens among the leadership ranks.

There are other reasons why investment and innovation, as well as consumer welfare, are higher in the U.S. market, even if mobile service provider prices do not seem to paint that picture.

In large part, high use of mobile data services, and the expected impact of video consumption, virtually forced U.S. operators to invest in 4G, to gain both capacity and efficiency.

Every communications market can be unique in some ways. But comparisons with the U.S. market that look only at prices fail to capture the other dynamics at work.

Convergence around LTE, for example, unifies air interface standards for the first time, creating bigger and more efficient markets for infrastructure and handset products, for example. It is true that Canadian operators have the same division between GSM and CDMA air interfaces.

But the scale of U.S. networks, compared to Canadian networks, means vastly more upside is obtained by unifying all air interfaces around LTE.

At least impressionistically, one might argue the Canadian mobile market illustrates why robust competition is not likely when there are only three leading national providers.

That probably is not a reasonable comparison.

Friday, May 30, 2014

Regulatory Incongruity Grows, Net Neutrality is But One Example

As the barriers between industries become porous, so too do inconsistencies in regulation. To cite only one example, incumbent telcos are regulated much more stringently than cable TV companies, ISPs and satellite providers of similar services. Competitive local exchange carriers are regulated differently from incumbent telcos.

And over the top apps are lightly regulated, to the extent there is any regulation at all.

So one key principle--equal treatment of suppliers of similar services--has grown incongruous.

The separation of network access from application access (over the top Internet applications can be used on any network; apps can be offloaded to third party networks using Wi-Fi) have huge implications for app providers, cable TV, satellite and telephone service providers alike.


The most-important implication is that revenue shifts. It is possible to buy video entertainment, voice services and messaging from different providers than the entity providing the “access” connection.


That is similar to the revenue shifts that have transformed the newspaper, book publishing and music industries, for example. If one assumes that, over the long term, revenue follows audiences, there is more damage to come.


print-based advertising revenue dropping from about $65 billion in 2000 to about $17 billion in 2013, a fall of more than 70 percent.


Coincidentally, that $17 billion is almost exactly the same amount that Google made last year from advertising in the United States, according to eMarketer.


It is impressionistic, not directly causal, but revenue might be said to have shifted from print to online in an almost direct fashion.


That, fundamentally, lies at the heart of the network neutrality debate, in several ways. Access providers are trying to create new features and services that generate revenue to replace what is lost to OTT providers.


App providers want to avoid any such measures that increase their operating costs. Whatever the public policy arguments, there are direct revenue implications for access and app providers who are parties in the debate.


As the regulatory framework for U.S. network neutrality is considered by the Federal Communications Commission and potentially, Congress, there are some advocates of applying common carrier regulation to Internet access services.


John Strand, Strand Consult principal, thinks the argument also can be made that over the top application providers should be regulated in the same way as facilities-based access providers, at least when providing applications or services that are functionally the same as those provided by access providers.


National telecom regulators still discriminate against access providers by subjecting them to strict requirements while allowing companies such as Google, Apple, Microsoft, Facebook, and Netflix to operate with free rein and without regulation to sell services that traditionally have been subject to strict government control, Strand argues.


Over the top (OTT) providers offer many of the same services as traditional providers including linear video entertainment, video on demand, messaging, mail, hosting, and a range of national and international voice-related services.  


One way to address the problem would be to create a level playing field:  removing the regulations and obligations that access providers face so that they can compete freely and fairly with OTTs, Strand argues.


There are two fundamental approaches: deregulate existing providers or apply the existing rules to new providers.


Strand calls OTT app suppliers “Tier 0 providers,” and notes that, by financial measures,
the leading OTT app providers have larger user bases and market capitalizations than the world’s telecom operators.


The volume of voice, video and message traffic delivered by OTTs now exceeds the level of most telecom providers.  


The OTT share of the total revenue of the industry is increasing while they pay very little tax, support little local employment, and do not support network investment outside of their own proprietary servers and data centers, Strand argues.


In that regard, net neutrality essentially is anti-competitive and anti-innovation, Strand argues.

To be sure, the very structure of the Open Systems Interconnect model, and the way modern software works, is that the application layer is fundamentally separated from the physical and data link layers that make up the “access network.”

Europe, U.S. Markets On Track for Widespread 100 Mbps by 2024

Since 2010, regulators in the United States and European Union have called for dramatically-faster Internet access, both targeting speeds of 100 Mbps by about 2020, in the case of the EC.

The U.S. Federal Communications Commission’s National Broadband Plan calls for providing at least 100 million U.S. homes with “affordable access” to actual download speeds of at least 100 megabits per second and actual upload speeds of at least 50 megabits per second, without setting a specific time frame.

At the time both initiatives were launched, the goals might have seemed farfetched. In 2010, according to Akamai, typical U.S. and European access speeds were about 4 Mbps, though some studies showed higher speeds.

That we now have major Internet service providers talking about, and in some cases, building networks capable of supplying gigabit Internet access shows how fast supplier thinking has changed since 2010, and how fast higher speeds are being made available, despite a persistent sense in some quarters that progress is way too slow.

In 2002, most U.S. households did not even have access at 1.5 Mbps. By 2013, according to Akamai, typical U.S. speeds were about 10 Mbps, showing roughly an order of magnitude increase over a decade. By that metric, 100 Mbps should be what a typical user buys by about 2024.

The European Commission’s Connected Continent initiative reports that broadband availability now is 100 percent across the EC region, with consumers having multiple choices of service providers.

Access speed, though, remains an issue. People able to use 4G mobile Internet access also rose to 59 percent, up from 26 percent a year ago.

Fixed network Internet access operating at 30 Mbps or higher is available to 62 percent of the EU population, up from 54 percent  a year ago and just 29 percent in 2010.

Fast broadband is already available to 90 percent of homes or more in Belgium, Denmark, Lithuania, Luxembourg, Malta, the Netherlands and the United Kingdom.

As you would guess, the biggest problems are rural areas, where 18 percent of rural households have access high-speed broadband access.

The current objective is downstream speeds of 30 Mbps for everyone in the EC region and at least 50 percent of European households subscribing to Internet connections above 100 Mbps by 2020.

Those goals were announced in 2010.

Standard fixed broadband now covers 95.5 percent of EC homes, while rural coverage of standard fixed broadband was 83 percent at the end of 2012, to an EC broadband report reporting status up to July 2013.

Connections capable of providing at least 30 Mbps download cover 54 percent of EU homes. Cable has the highest coverage, at 39 percent of homes, followed by  very high speed digital subscriber line at 25 percent and fiber to the home at 12 percent of homes.

What in the United Kingdom is called “superfast” (30 Mbps or faster) access accounts for 20 percent of all fixed broadband lines in the EC, as opposed to 12 percent a year ago. Some 57 percent  of such connections are supplied by cable TV operators.

In fact, new entrants provide 77.5 percent of faster connections.

About two percent of homes buy fixed network service operating at 100 Mbps or faster.
About 15 percent of homes buy service at 30 Mbps or faster.

Though consumer behavior might have suggested there was little demand for 50 Mbps or 100 Mbps Internet access in the past, the primary reason for limited demand was the cost. As gigabit access network pricing has been redefined, to about $70 or $80 a month in the U.S. market, for example, demand is at least as high as for today’s more common 20 Mbps to 40 Mbps services.

Thursday, May 29, 2014

Deutsche Telekom Agrees to Softbank's T-Mobile US Acquisition

Deutsche Telekom apparently has agreed to a plan by Japanese mobile company Softbank Corp. to buy T-Mobile US.

Softbank Chairman Masayoshi Son proposed the buyout in a meeting with top executives of T-Mobile and Deutsche Telekom in mid-May, 2014.

The issue is whether antitrust authorities and the Federal Communications Commission also will agree, and if so, what conditions might be required in order for Softbank's Sprint unit to gain approval.
save image
source:Statista


The U.S. Justice Department already believes the U.S. mobile market is too concentrated, using the Herfindahl−Herschman Index (HHI) method.

"Tokens" are the New "FLOPS," "MIPS" or "Gbps"

Modern computing has some virtually-universal reference metrics. For Gemini 1.5 and other large language models, tokens are a basic measure...