The telecom industry might be described as akin to the airline industry, in some key respects. Both industries are relatively highly regulated but also subject to lowish barriers to entry on the low end, capital intensive, unionized and subject to global competition.
The cost of capital is key for some providers, in some industries that have net profit margins as low as five percent. In the global airline industry, In 2015 the industry’s return on capital of 8.3 percent will exceed the cost of capital (debt and equity) of just below seven percent, for example.
What that essentially means is that airlines could have invested money in safer vehicles and earned just 1.3 percent less than assuming all the business risk of operating an airline.
Other studies suggest the cost of capital for U.S. airlines is lower, at about 5.64 percent, however, meaning telecom service providers arguably have more margin to work with.
On average airlines will still make less than $10 per passenger carried, according to the International Air Transport Association. That might remind some of you of the grocery business, where profit margins are closer to one percent to two percent, overall.
The industry’s profitability is better described as “fragile” than “sustainable,” said Tony Tyler, IATA Tony Tyler, IATA’s CEO. Some might, by way of analogy, suggest telecom company profitability likewise requires a great deal of work.
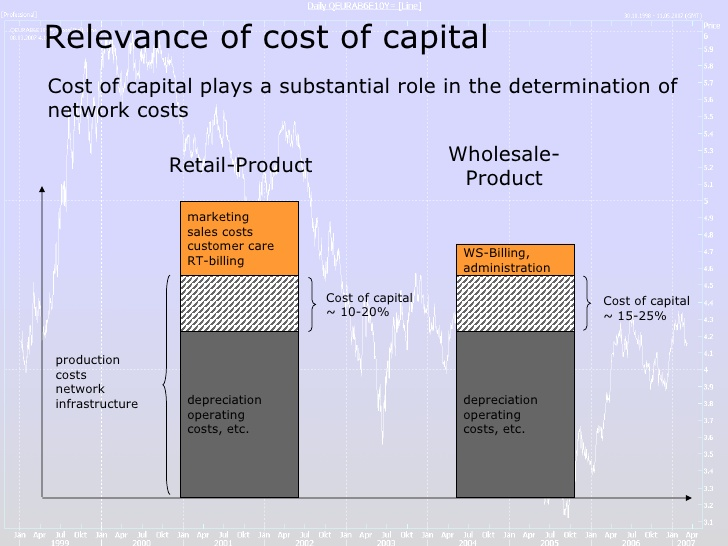
Cost of capital in the telecom business might represent between 10 percent and 25 percent of total operating costs.
Airline Industry Net Profit Margin
| |||
2015
|
Net Profit
|
Net Margin
|
Profit per Passenger
|
Global
|
$33.0b
|
4.6%
|
$9.31
|
North America
|
$19.4b
|
9.5%
|
$22.48
|
Europe
|
$6.9b
|
3.5%
|
$7.55
|
Asia Pacific
|
$5.8b
|
2.9%
|
$4.89
|
Middle East
|
$1.4b
|
2.3%
|
$7.19
|
Latin America
|
-$0.3b
|
-0.9%
|
-$1.05
|
Africa
|
-$0.3b
|
-2.1%
|
-$3.84
|
While U.S. mobile service providers have a 5.5 percent cost of capital, U.S. fixed network cost of capital is 6.31 percent, according to Aswath Damodaran of the NYU Stern of Business.
The big cost there is the cost of equity, at about 8.8 percent for mobile firms and 8.3 percent for fixed network firms. The cost of debt for mobile and fixed segments is 3.67 percent.
So the search for replacement revenue sources is a major strategic objective for every fixed network services provider, indeed for every legacy communications or content service provider, especially given the high sunk cost of fixed networks and the obvious dwindling of legacy revenue sources.
Some have argued that the rate of return from FiOS has been negative, for Verizon, where cost of capital has been about five percent for fixed network assets, while returns have been as low as 1.2 percent.
Capital investment provides another illustration of business dynamics. Since about 2000, mobile capex has risen, while fixed network investment has declined.
It does not take much insight to note that expected returns from the fixed network business are perceived to be far lower than expected returns from the mobile business.
In fact, since about 2002, capital investment levels in U.S. fixed networks have been negative.
The caveat is that business models for tier-one providers and smaller upstarts--or contestants with different business models--could be significantly different, as many would note capital and operating costs are lower for cable TV companies, compared to their telco peers.
The upsurge of independent Intrernet service providers provides one example of different--and lower--capital and operating costs. Google Fiber provides an example of contestants with different business models.


No comments:
Post a Comment