The GSMA today announced that its Mobile IoT Initiative has lead to the launch of multiple commercial rollouts of Low Power, Wide Area (LPWA) solutions using licensed mobile spectrum, by several of the world’s leading mobile operators including AT&T, China Mobile, China Unicom, China Telecom, Deutsche Telekom (DT), Verizon and Vodafone.
It is likely such efforts produce relatively little revenue yet, as LPWA networks are not so prevalent, yet, and traditional mobile connections (on the standard mobile networks) likely drive nearly all the present revenue.
At present, U.S. mobile service providers likely earn only a couple of billion dollars a year from IoT connections. By some estimates, IoT accounts already represent existing connectivity revenue of about $3 billion in China.
The larger point is that it still is much too early to say very much about how big the IoT connectivity market might eventually become.
“IoT connectivity revenue will only reach US$28 billion by 2025, representing just three percent of worldwide mobile telecoms revenue,” according to Analysys Mason.
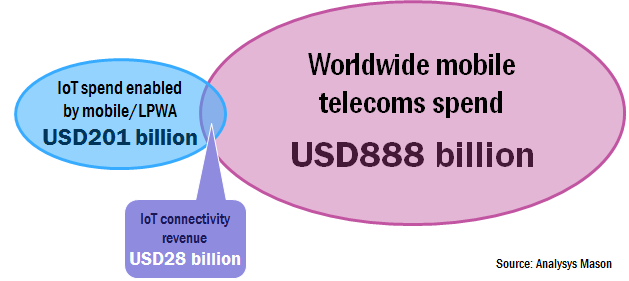
“If IoT is to become a new growth area within the telecoms industry, it will need to contribute significantly more revenue to the overall business than connectivity alone can generate,” Analysys Mason notes.
China Mobile and China Unicom have launched NB-IoT across several key cities with China Telecom launching NB-IoT networks across the country. Vodafone has also launched NB-IoT in Spain and the Netherlands.
DT has launched in several cities in Germany and nationwide in the Netherlands. AT&T and Verizon have previously announced nationwide launches of LTE-M technology.
In addition to these deployments, the GSMA also announced that its Mobile IoT Innovators programme, which is designed to encourage the development of new LPWA solutions, has reached over 500 members, underscoring the growth of the wider IoT ecosystem.
Gartner forecasts that 8.4 billion connected things will be in use worldwide in 2017, up 31 percent from 2016, and will reach 20.4 billion by 2020. Total spending on endpoints and services will reach almost $2 trillion in 2017.
Regionally, Greater China, North America and Western Europe are driving the use of connected things and the three regions together will represent 67 percent of the overall IoT installed base in 2017, Gartner argues.
The consumer segment is the largest user of connected things with 5.2 billion units in 2017, which represents 63 percent of the overall number of applications in use.
"Aside from automotive systems, the applications that will be most in use by consumers will be smart TVs and digital set-top boxes, while smart electric meters and commercial security cameras will be most in use by businesses," said Peter Middleton, research director at Gartner.
IoT Units Installed Base by Category (Millions of Units)
| ||||
Category
|
2016
|
2017
|
2018
|
2020
|
Consumer
|
3,963.0
|
5,244.3
|
7,036.3
|
12,863.0
|
Business: Cross-Industry
|
1,102.1
|
1,501.0
|
2,132.6
|
4,381.4
|
Business: Vertical-Specific
|
1,316.6
|
1,635.4
|
2,027.7
|
3,171.0
|
Grand Total
|
6,381.8
|
8,380.6
|
11,196.6
|
20,415.4
|
Source: Gartner
In addition to smart meters, applications tailored to specific industry verticals (including manufacturing field devices, process sensors for electrical generating plants and real-time location devices for healthcare) will drive the use of connected things among businesses through 2017, with 1.6 billion units deployed.
From 2018 onwards, cross-industry devices, such as those targeted at smart buildings (including LED lighting, HVAC and physical security systems) will take the lead as connectivity is driven into higher-volume, lower cost devices, Gartner predicts.
While consumers purchase more devices, businesses spend more. In 2017, in terms of hardware spending, the use of connected things among businesses will drive $964 billion.
Consumer applications will amount to $725 billion in 2017. By 2020, hardware spending from both segments will reach almost $3 trillion.
IoT Endpoint Spending by Category (Millions of Dollars)
| ||||
Category
|
2016
|
2017
|
2018
|
2020
|
Consumer
|
532,515
|
725,696
|
985,348
|
1,494,466
|
Business: Cross-Industry
|
212,069
|
280,059
|
372,989
|
567,659
|
Business: Vertical-Specific
|
634,921
|
683,817
|
736,543
|
863,662
|
Grand Total
|
1,379,505
|
1,689,572
|
2,094,881
|
2,925,787
|
Source: Gartner
Total IoT services spending (professional, consumer and connectivity services) is on pace to reach $273 billion in 2017, Gartner argues. The huge proportion of that spending is on the actual IoT applications (including recurring fees) or the design and installation of such networks.


No comments:
Post a Comment