Showing posts with label Nielsen. Show all posts

Thursday, November 10, 2011

Smart phones Now the "Lead Offer"

Lead offers vary by segment, in the U.S. or any other communications market. For competitive local exchange carriers, the lead offer long has been a bundle of business broadband access and business voice.


Consumer fixed-line providers have been leading with the triple play of consumer video, voice and broadband access. 


Wireless providers might arguably be leading with a device, not so much services. Basically, the "smart phone" now is the lead offer for a wireless provider, with data access, voice and texting becoming features. 


More than one-half (55 percent) of US consumers who purchased a new handset in the three-month period ended May 2011 bought a smartphone instead of a feature phone, up from the 34 percent who did so during the same period one year earlier, according to a survey from Nielsen.


Overall, 38 percent of U.S. consumers owned a smartphone as of May 2011, and 62% owned a feature phone. Smart phones as lead offer

Thursday, May 5, 2011

Tablet Usage Affecting Other Devices

ConnectedDeviceschart1Around half of all tablet owners reported being the only ones in their household using their particular tablet, while 43 percent said they shared the tablet with others, according to Nielsen. Eight percent said that while they own a tablet used by other household members, they do not use it themselves.

When asked whether they used other connected devices more often or less often since purchasing a tablet, 35 percent of tablet owners who also owned a desktop computer reported using their desktop less often or not at all, while 32 percent of those who also owned laptops, said they used their laptop less often or never since acquiring a tablet, Nielsen says.

Twenty-seven percent of those who also own eReaders said they use their eReader less often or not at all, the same percentage as those who also own portable media players. One-in-four tablet owners who own portable games consoles are using those devices less often, if at all, since purchasing a tablet.

Sunday, January 23, 2011

Mobile Video Consumption Up 47%

While the number of people watching videos on their mobile phones remains relatively small compared to TV, they are increasingly using the devices to that end. On a year-to-year basis, the number of people watching mobile video increased more than 43 percent, while the amount of time spent doing so was up almost seven percent, according to Nielsen.

 read more here

Overall Usage Number of Users 13+ (in 000s) – Monthly Reach
Q2 2010Q1 2010Q2 2009% Diff Yr to Yr
Using a Mobile Phone ^229,375229,495220,527+3.99%
Mobile Subscribers Watching Video on a Mobile Phone ^21,95720,28415,267+43.82%
Source: The Nielsen Company
As of Q2 2010, 22 million people watched video on a mobile device

Friday, January 21, 2011

Mobile Shopping and the Just-in-Time Consumer:

U.S. consumers are changing the way they shop, and one has to wonder what role mobile shopping applications could have in the future, based on those changes. It isn't just that people can use, and do use, their mobiles for product research and evaluations. There is a physical dimension as well.

A study by Nielsen finds that consumers are making more small trips to the store, even as they also increase trips to big-box supercenters and club retail channels for larger purchases. Both behaviors are typical of the most-affluent shoppers, not just the rest.

Trips with a smaller sales volume are of greater importance to the grocery, drug, convenience, gas and dollar channels, but trips resulting in larger purchase voluems are gaining ground. Here too there are differences across income classification, providing opportunities for retailer/store-specific and consumer segment trip-type solutions.

Shopping trips are segmented into four types, according to Nielsen. "Immediate" trips tend to be conducted for low-value products for which there is an immediate need, and tend to average sales of $15 per trip. "Fill-In" trips feature slightly higher value baskets averaging $51 per trip.

"Routine" trips are weekly, high-value shopping trips averaging $98 per trip while "Stock-up" trips average $242 per trip.

By household income, affluent households ($100,000 or more) ncreased the percentage of smaller trips within supercenters and club stores, and drove more frequent and larger trips in smaller formats such as drug, convenience and dollar stores.

The $70,000 to $99,000 income households reduced larger trips across most channels, but increased smaller trips within supercenters and club stores. Stock-up trips were generally off among these households.

$50k – $69.9k – Middle income households ($50,000 to $69,900) shopped less frequently overall while increasing their trips to value-centric supercenters and dollar stores.

Households in the $40,000 to $49.900 income range decreased trips across most channels, but these households increased their immediate, fill-in and routine trips to club stores, with smaller and stock-up trips to dollar stores also up.

Households in the $30,000 to $39,900 income range increased the number of small trips and supercenter trips, but stock-up trips declined by 10 percent in that channel.

Households in the $20,000 to $29.900 range slightly increased trips to smaller supercenter and club trips, while stock-up trips declined by 10 percent. Dollar stores are performing well among this income group that retailers are targeting.

Households with income less than $20,000 made drastic cutbacks on small grocery trips, while increasing larger grocery and club trips. This may be indicative of pay period buying behavior. This income group shows big drops in larger supercenter trips and softness in dollar store trips.

One might argue that mobile marketers should focus on the fewer trips with higher volume. Those trips tend to be for "repeat" purchase items where a chance to switch brand preference could have long-lasting impact. But one might also argue that there are truly few products, even those bought on "immediate" trips, that do not have brand preference angles. In fact, even before a shopper has a chance to choose between brands on the shelves, a prior decision has been made to visit a particular retail outlet.

The issue is the role mobile marketing can play in shifting locational preference before a shopper is physically in aisles, and then to shift brand preference while shoppers are in the store, shopping. Obviously, mobile marketers will, by default, wind up focusing more on higher-income households to a large extent, because those are the homes with smartphones. But that is going to change over time, as the smartphone becomes the standard device.

Thursday, July 1, 2010

Mobile Data: Not the Deluge You Might Expect

Average mobile data consumption increased from about 90 MBytes per month during the first quarter of 2009 to 298 MBytes per month during the first quarter of 2010, according to Nielsen.

This represents a year-over-year increase of approximately 230 percent. While this increase is substantial, in the first quarter of 2009 more than a third of smart phone subscribers used less than 1 MByte of data per month and usage has dropped to a quarter in the first quarter of 2010.

About 20 million current smartphone users are hardly using data.

Friday, June 11, 2010

51% Mobile Video Growth Since 2009


Nielsen's latest "Three Screen Report" shows 51 percent growth of video watching on mobile phones, with a perhaps-surprising skew of demographics.

About 55 percent of the mobile video audience is aged 25 to 49. Also, the number of people with multi-tasking behavior, where users "watch" TV while using their PCs, was down in March 2010, though the length of time spent was up about 10 percent for people who did multi-task.

More than half of U.S. TV households now have a high-definition television and receive high-definition signals, while HDTV penetration grew 189 percent between the first quarter of 2008 and the first quarter of 2010.

More than a third of homes have a digital video recorder, up 51percent over the last two years.

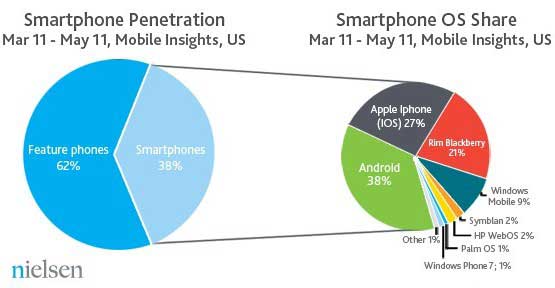
About 64 percent of U.S. homes now use broadband Internet access while nearly a quarter of households (up 38%
year-over-year) have smartphones. The former trend means more uses can stream or download Internet video, while the latter trend means more place-shifting behavior, as well as some amount of incremental video consumption.

The amount of time spent watching television is still increasing. U.S. viewers watched two more hours of
TV per month in the first quarter of 2010 than in the first quarter of  2009.

The average time spent simultaneously using TV and Internet in the home also grew 9.8 percent, to 3 hours and 41 minutes per month, though the number of people doing so declined.

The number of people who are timeshifting has grown 18 percent since last year to 94 million, with the
average user now timeshifting 9 hours and 36 minutes per month.

The mobile video audience grew 51.2 percnet  year over year, surpassing 20 million users for the first time.

Beyond the TV, technology is helping drive video use on the “second” and “third” screens. The proliferation of broadband access is bolstering online video, creating an alternative mass outlet for distributing television content and “timeshifting” long-form TV.

Similarly, the increased popularity of smartphones has created yet another opportunity for incremental viewing, and Nielsen logically expects smartphone video viewing to keep growing. On top of that are new devices such as tablet PCs that also are expected to increase the amount of mobile video viewing.

Friday, February 5, 2010

Why Do People Watch Online Video?

Cord cutting, the substitution of online video for cable, satellite or telco TV, is not the reason most people watch online video, a new study by Nielsen suggests.

In fact, online video watching competes most with digital video recorder viewing. People essentially are time shifting their viewing, not replacing linear TV as the "cord cutting" thesis suggests.

Friday, December 21, 2007

Who Will Sue Google for Incorrect Traffic?


Spain's top media company Prisa said Monday it had taken legal action against Nielsen for miscounting traffic to its ElPais.com Web site as well as readers of its newspaper.

Prisa said its Internet arm Pisacom and El Pais were suing Nielson "based on the damage caused by the unjustified downward revision in the number of unique visitors of ELPAIS.com during the current year."

"The lawsuit argues that due to the serious negligence on the part of Nielson in its measurement of audience figures for ELPAIS.COM, El Pais and Prisa suffered serious damages due to lost advertising this year."

Data from marketing firms like Nielsen are important in determining the amount websites charge for advertising, with sites with high viewing figures being able to charge higher fees to sponsors. Networks sometimes have such disputes with the firms doing the counting.

One has to wonder when somebody will sue Google for mishandling a search ranking.

"Tokens" are the New "FLOPS," "MIPS" or "Gbps"

Modern computing has some virtually-universal reference metrics. For Gemini 1.5 and other large language models, tokens are a basic measure...