Showing posts with label pareto. Show all posts

Tuesday, September 6, 2011

Sprint User Base is Different


Lots of people have offered, and will continue to offer, advice about how Sprint can do better in the U.S. mobile market, whether or not the AT&T deal to buy T-Mobile USA succeeds, or not. Advice, one might argue, is easy to give, especially when it concerns how any firm, lead by any set of talented managers, can change its fundamental position in a market whose structure is fairly well fixed.

Though some will question the continued relevance, a long-standing study of firms in many industries, taking a look at market share, quality and profit margin, suggests that it is very hard to change firm position in an established industry. Market share patterns

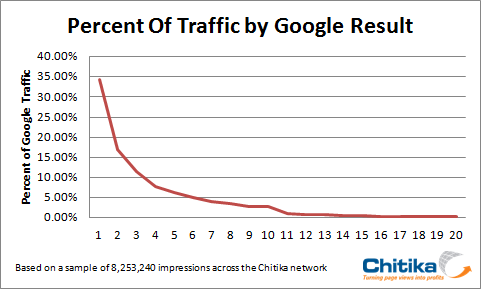
Though the existence of a correlation is not necessarily a causal relationship, there is relatively significant evidence that markets develop patterns. Pareto_principle Among the more-enduring patterns is a tendency towards market concentration by a handful of leaders.

Some might argue, for that reason, that the current U.S. mobile market structure is not unusual, and might become even more concentrated over time. The informal rule of thumb might be that in any market, most of the share i(80 percent or so) is held by a small number of providers (perhaps 20 percent or fewer).

The U.S. mobile industry is more concentrated than that, but you get the point. It would be difficult under the best of conditions for Sprint Nextel to dramatically change its position in the market. But, that noted, there are some apparent differences of end user behavior that could provide something of an opening.

Some of us would not say the differences necessarily offer Sprint a way to change its market position in a dramatic way, but might offer a way to help solidify its current position. The difference is the apparent preference for Android among Sprint users, or perhaps Sprint’s willingness to bank on Android for some highly-popular devices such as the HTC Evo line.

Note recent Yankee Group surveys indicating that Sprint users are heavy users of Android devices. It is of course possible that the data reflects Sprint’s historic inability to sell the Apple iPhone, forcing Sprint to emphasize the HTC Evo as a lead offer, and thus producing the skew Yankee Group found.

One might similarly argue that Verizon Wireless faced the same problem in the days when it also could not sell the Apple iPhone. If so, it always is possible that the Android preferences illustrated by Yankee Group are a tactical, short term user demand trend that easily could change in the future.

Still, no matter what happens with the AT&T bid to buy T-Mobile USA, Sprint is going to have to work pretty hard simply to solidify some distinctive position in the market, even as a “distant third” provider, compared to Verizon Wireless and AT&T.

It does presently appear, however, that Sprint users consume more data, and use Android, more so than customers of the other top four networks. 


Thursday, April 28, 2011

Search Results Follow Market Share Rules

Many years ago, I learned that there are fairly reliable relationships between market share and profitability. Basically, the rule is that the number-one provider in any market has twice the market share of provider number two, which in turn has twice the share of provider number three. It's a remarkably useful rule of thumb.

A new examination by Chitika, looking at the value of Google search results, ranked by share, is remarkably consistent with those rules of thumb about market share.

As it turns out, the number-one search result tends to get double the traffic of the number-two result. The Chitika data also shows that search result three has 11.4 percent share, while the number-four result has eight percent share. That's pretty close to what the rule of thumb would suggest.

Traffic by Google Result
If the number one result has 34 percent share, the rule would predict the second result to be 17 percent, which is precisely what Chitika found. The rule also would suggest result three would have 8.5 percent share. In the Chitika data, the third search result has 11 percent share. The fourth result has eight percent share, as the rule suggests would be the pattern.

In search results, as in other markets, share makes a huge difference. The other thing you might recognize is a standard Pareto distribution, sometimes known as a "long tail" or 80/20 rule.

Rules of thumb can be excellent guides to strategy, if a company really wants to lead a market. It's also nice to know that at least some things one learns in school turn out to be correct in real life. 

Friday, December 31, 2010

95% of Twitter Accounts Created Since January 2009

Fully 95 percent of the current Twitter accounts were created after January of 2009, according to an analysis by Sysomos. That is some serious scaling.

The other significant finding is that roughly 22 percent of users produce 90 percent of the tweets.

If you are familiar with the Pareto Principle, that is precisely what one would expect to find.

Thursday, December 16, 2010

Twitter Illustrates Pareto Distribution

The "long tail" distribution is a standard Pareto distribution, popularly thought of as the "80/20" rule, where a disproportionate share of just about anything comes from a fraction of the causes.

Twitter followers in December 2010 show a clear Pareto distribution, as do people that Twitter users "follow."

The clear implication for things such as market share in any sphere of business will also have a Pareto distribution.

The implications for businesses and organizations that use Twitter as a social tool is that, in all likelihood, modest expectations should be watchword. It is highly unlikely most companies and organizations will ever appear at the head of the tail. Those spots normally are held by celebrities of one sort or another.

That isn't a reason not to use Twitter, just a reminder to be realistic about expectations.

Wednesday, September 29, 2010

Not So Many Twitter Replies and Retweets

There is a notion that social networking communication patterns "should be" symmetrical, or something sort of symmetrical, or at least highly interactive.

Systomos finds this is not the case. After analyzing 1.2 billion tweets, Systomos found that that 29 percent of all tweets produced a reaction of any sort, either a reply or a retweet.

Of this group of tweets, 19.3 percent were retweets and the rest replies. This means that of the 1.2 billion tweets we examined, six percent, or 72 million were retweets.

Sysomos also discovered that 92.4 percent of all retweets happen within the first hour of the original tweet being published, while an additional 1.63 percent of retweets happen in the second hour, and 0.94 percent take place in the third hour.

That's a classic "Pareto" distribution, often known as the "80/20" rule or a "long tail" distribution. Since so many processes and distributions in the natural world follow a Pareto curve, this should come as no surprise.

Pareto would suggest that a small number of tweets produce most of the replies or retweets. And that is precisely what Sysomos found.

Saturday, May 22, 2010

How Much Competition Is Possible in Telecommunications?

What makes a market workably competitive? That might not be a tough question in the abstract. Most people would probably agree that multiple competitors in any market are good for competition, and therefore good for consumer welfare. Matters are tougher when looking at capital-intensive industries.

Most people, and most economists, might agree that dams, highways, electrical and water systems tend to be so capital intensive that they are "natural monopolies." In such cases, competition from other firms likely is unworkable because there simply is no way as few as two providers could make money over the long term.

Typically, such firms are allowed to operate as highly-regulated monopolies. 

At the other end of the spectrum, most people might agree that consumer goods tend to be wildly competitive, and do not typically require much reguluation as such, though other "product safety" regulations might be appropriate. Where markets are robust and can function, most people likely tend to believe there is no fundamental need for price and other forms of "monopoly provider" regulation, as consumer choice leads to restraint on predatory supplier behavior. 

But there are some industries in between these relatively clear cases. Airlines once were highly regulated, though perhaps the airline industry has not had perceived monopoly characteristics as did the telephone industry. Many are too young to remember it, but there once was no choice in telecom services. Everybody bought from one supplier, AT&T, in about 85 percent to 90 percent of cases (there always have been some areas served by other providers, on a monopoly basis). 

The point is that the number of firms that a market can sustain is directly related to the size of potential addressable market and the cost of entering that market. In fact, says Ford, "having only a few providers does not imply poor economic performance, but might indicate intense competition." 

The point is that the number of firms that a market can sustain is directly related to the size of potential addressable market and the cost of entering that market. In fact, says Ford, "having only a few providers does not imply poor economic performance, but might indicate intense competition." 

Neither regulators nor most people likely believe anymore that telecommunications actually is a natural monopoly. 


But the industry is hugely capital intensive, so the question does arise: how many competitors in a single market are required so that most of the benefits of competition are reaped? 


There are subsidiary questions such as what the relevant "market" is, but the key question is the number of sustainable competitors a given telecom market can support. Some people used to debate whether services provided by wireless networks were, in fact, part of the same market as the wireline segment of the market. 


The point is that it is possible, perhaps likely, that telecommunications markets cannot sustain acilities-based competition by more than a smallish number of viable competitors. If that is the case, then a small number of competitors is not, by itself, evidence of an uncompetitive market. 


In voice services, this already has proven to be true. There now are three times as many mobile "voice" accounts in service as there are fixed voice lines, and the disparity is growing. In the multi-channel video markets, fixed providers now see the satellite firms eating away at fixed-network market share as well. 


And the next question is the extent to which wireless will likewise expand and displace significant portions of the fixed broadband market as well. The point is that wireless and wireline contestants are in the same market, though not each contender competes in every segment of the market. 

Lots of people appear to believe two competitors is too few. Such views tend to point to cable versus telco competition as the salient example. But recent pricing and product trends in the high-speed broadband and voice markets suggest there is a clear trend of price declines in both markets, as well as a continual "price per megabit per second" as well. The former is important as it suggests competition is working; the latter is important because it suggests competition is forcing providers to upgrade the quality and features of the product over time.

That is not to say everyone is happy with the level of competition, which is workable, if not "complete." But it also remains the case that the number of competitors in either the wired or wireline business "always" will be limited to a relatively small number of competitors, because of the capital intensity of the business and the startling impact of just a few competitors in the market on achieveable business results.

Simply put, beyond several competitors in a single market, it might not be possible for any firm to sustain a business in either the wireless or fixed portions of the market.

For example, a theoretical market with a $1 million revenue potential, a monopoly price of $100 per customer, with $100,000 required to enter the market, with variable costs of $10 per customer, and each additional firm reducing profit margins by 10 percent, would typically result in a market structure where no more than seven firms could make a profit of any sort.

And a normal Pareto distribution would have 80 percent of the profits earned by the first two players, with the typical long tail of profit for the remaining players.

The point is that it is not unusual for a Pareto distribution to exist, though not in "idealized" form, in most markets, including telecommunications, which is a scale business. In fact, if one looks at a single retailers sales of products over a month's time, what one sees is another Pareto distribution. Most of the revenue comes from the sale of just seven percent of products. The point is that highly-uneven and highly-unequal Pareto distributions are commonplace.

So are two players enough to create workable competition? Maybe, though not always. That arguably is true for the consumer high-speed access market.

But one might argue from history that the U.S. wireless market was somewhat competitive in the 1970s when a duopoly essentially existed, but become vigorously competitive when additional spectrum was granted to other players with the "Personal Communications Service" spectrum awards. Since then, the U.S. market has shown strong signs of being robustly competititve on virtually all consumer metrics. In the U.S. wireless market, a two-player market does not seem to have produced as much competition as a three-player or four-player market. Still, returns are unequal and uneven.

Some will point to the dominance of two firms, but that would simply confirm that the wireless market is a typical market, with a Pareto distribution. If one looks at developer interest in creating apps for smartphones, the distribution of interest is a classic Pareto distribution, with the most interest clustered around just a few devices, and then dropping off in a classic "long tail" distribution.

In fact, outsized returns for two firms with outsized market share is the normal and expected state of affairs in any market, especially a market with high capital investment barriers to entry, such as telecommunications. The point is that in a perfectly-competitive scenario, what we now see is what we would expect to see. The normal Pareto distribution would suggest something on the order of 80 percent of revenue, profit or market share to be held by just two firms.

"Tokens" are the New "FLOPS," "MIPS" or "Gbps"

Modern computing has some virtually-universal reference metrics. For Gemini 1.5 and other large language models, tokens are a basic measure...