Tuesday, June 20, 2017

Cisco Incorporates Machine Learning (Artificial Intelligence) in New Network

Machine learning (artificial intelligence) continues to be deployed in practical ways, including by Cisco routers and networks.

Cisco calls this intent-based networking and it incorporates machine learning to “create an intuitive system that anticipates actions, stops security threats in their tracks, and continues to evolve and learn.”

At least in part, the new network is built for pervasive computing, supporting enormous scale in terms of devices. “The new network provides machine-learning at scale,” Cisco says.

“We must move to a place where we build technology that is intuitive from the start and continues to evolve and learn over time,” says Cisco CEO Chuck Robbins.

“The new network delivers a world where you can connect billions of devices, identify them almost instantly, know what’s trustworthy and what isn’t, and draw exponential value from the connections – and you can do it in hours instead of weeks and months,” Cisco says.

Intent-based networking supports “a network with a purpose, one that can think ahead.”

Interpreting data with the right context is what enables the network to provide new, more meaningful insights, Cisco argues.

Monday, June 19, 2017

Will Microsoft Catch AWS in 2018?

Amazon Web Services leads the infrastructure as a service market, a finding virtually nobody would challenge, at least for the moment. For the moment, the  issue is Microsoft’s role in IaaS, as it is, according to Gartner, the leader in best position, at the moment, to challenge AWS.

“AWS remains the dominant market leader, not only in IaaS, but also in integrated IaaS+PaaS, with an end-of-2016 revenue run rate of more than $14 billion,” Gartner says. “It continues to be the thought leader and the reference point for all competitors.”

By way of comparison, Microsoft Azure is second in market share, with revenue run rate of about $3 million. That suggests annual revenues higher than $12 million.


What Will Drive Future Telco Revenue?

Internet access is the anchor service for both fixed and mobile service providers, if only because those two services generate the bulk of service provider revenue in many markets, and because video depends on high-capacity internet access.

AT&T’s first quarter 2017 financial results hint at the contribution made by video services, which drove 32 percent of total revenues. For Comcast, the cable communications business that corresponds to AT&T’s business had 45 percent of revenue driven by video, while 27 percent was driven by internet access.

It remains to be seen whether internet access revenue contribution will be greater than content revenues, in most markets, eventually. It is virtually certain that voice, no matter how important, is destined to shrink, as a revenue driver.

What is happening is that all legacy services are mature, or maturing. That suggests, eventually, that some new revenue contributor will emerge.

What Will Video ARPU Be, in the Future?

Only a few telecom products ever have been universally adopted by consumers. Voice, messaging, mobility, internet access and video entertainment are those products. Everything else is a niche. The paucity of universally-demanded services illustrates the problem of new service creation. It never has been easy, and will not be easy.

At the same time, it is easy to illustrate the new range of universally-demanded services, such as social networking, search and shopping, supplied as apps accessible “over the top,” and not intrinsically bundled with an access service.

Given the historic high demand for network-delivered content (video, especially), it comes as no surprise that OTT entertainment video services are so popular. As was the case for use of voice, new forms of highly-popular services (mobile voice rather than fixed) have much-higher value for consumers.

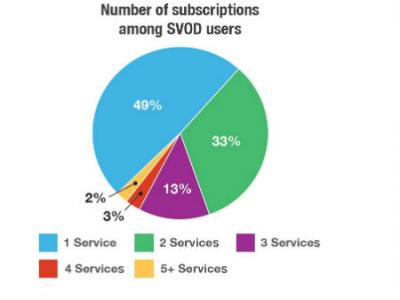
A majority of U.S. online consumers, for example,  now subscribe to at least one paid OTT video service, according to researchers at IBB Consulting Group.

About 33 percent of those subscribers buy two services and 18 percent subscribe to three or more services.

Some 63 percent of paid OTT subscribers also subscribe to a linear TV service from their cable, telephone or satellite provider.

What is not yet clear is how demand for “live” events and programming will develop. Up to this point, the largest streaming services have offered pre-recorded content. Only recently have services that deliver “real time” programming begun to be widely available.

To the extent that all OTT video services involve bundles of some sort--either bundles of pre-recorded content or bundles of “live” channels--one major question for suppliers is the future shape of bundles (large or small numbers of networks, live or pre-recorded content, content genres).

The biggest questions concern channels that mostly rely on “live” content, as it is somewhat obvious that pre-recorded content is “best” or “easily” delivered using some on-demand format. News (for some) and sports (for more) provide the clearest examples of content venues especially leading the “live” category.

At least so far, buying behavior suggests that for “libraries of content,” a price of about $10 a month for an OTT service is viewed by consumers as reasonable. Since about 60 percent of consumers buy both linear and at least one OTT service, current propensity to buy represents something north of $90 a month in total spending.

The big issue for OTT is whether average spending ultimately is closer to $10 a month than $100 a month. Many of us would argue the eventual result is a blended average revenue per user close to $50 a month, including $40 a month for a skinny linear bundle, plus at least one OTT service at $10 a month.

What is not clear is whether video suppliers can dramatically change the perceived value proposition. If so, ARPU could stickier on the high side. What the subscription video industry hopes will result is that when a big bundle is purchased, all or most of that content also can be viewed on a streaming, over the top basis. That would tend to maintain current spending levels.

On the other hand, most consumers do not view most channels, creating constant pressure to craft more affordable, smaller bundles that meet the needs of most consumers.


"Like and Dislike" Often Tell Us Nothing About Future Behavior

Consumer research always is difficult, but it is more difficult when questions about “value” are asked independently of price and other attributes. Consider the oft-noted observation that people hate ads.  In the abstract, and all other things being equal, that seems true enough.

But “liking or tolerating ads” is something different, if the issue is free content or “free functionality” in exchange for the ads, then people, even when not fond of ads, will tolerate them, within some reasonable bounds.

So people may not like ads, but will tolerate them so long as they see tangible benefits in exchange. That noted, there is a value-price relationship that content providers and advertisers have to be aware of.

Consumers will not tolerate  “excessive” amounts of advertising, or “highly intrusive” forms of advertising, repeated too often.

The point is that asking consumers what they like, and do not like, in the absence of value and cost considerations, will nearly always fail to capture or predict actual behavior.

Asking a typical consumer whether they “like ads” does not provide valuable insight. Behavior depends on the full value-cost relationship. Most consumers will tolerate some advertising to obtain free content or use of apps, with no major issues (think of Facebook, Google or other ad-supported services and apps).

Consumers might also say they prefer “no ads” experiences. But behavior depends on the mix of value obtained and costs paid to have an “ads-free” experience. Perhaps few consumers would choose “no ads” experiences if it meant substantially higher cost to use their favored apps and services.

It is generally true that consumers “hate advertising.” It also is true that those attitudes do not generally matter, when ads support free use of apps and services they value.

Design Element
Users Answering
"Very Negatively"
or "Negatively"
Pops-up in front of your window
95%
Loads slowly
94%
Tries to trick you into clicking on it
94%
Does not have a "Close" button
93%
Covers what you are trying to see
93%
Doesn't say what it is for
92%
Moves content around
92%
Occupies most of the page
90%
Blinks on and off
87%
Floats across the screen
79%
Automatically plays sound
79%

source: Nielsen Norman Group

Sunday, June 18, 2017

Will Azure Catch Amazon?

With the caveat that comparing Amazon Web Services and Microsoft’s Azure is a bit of an “apples compared to oranges” situation, Azure seems to be emerging as the key challenger to AWS.

AWS revenue grew 43 percent year-over-year to $3.7 billion (a run rate of about $14 billion annual), in the first quarter of 2017.

Azure reported a 93 percent increase in sales for the same period. Azure includes the Microsoft cloud application businesses The “Intelligent Cloud” business unit grew sales growth of 11 percent year-over-year to $6.8 billion.

Synergy Research Group data suggests that Amazon Web Services (AWS) is maintaining its dominant share of the public cloud services market at over 40 percent, while the three main chasing cloud providers--Microsoft, Google and IBM--are gaining ground but at the expense of smaller players in the market.

In aggregate the three have increased their worldwide market share by almost five percentage points over the last year and together now account for 23 percent of the total public IaaS and PaaS market.

Still, analysts at Pacific Crest now argue that Azure is set to surpass Amazon Web Services (AWS) revenue for the first time in 2017.

"We estimate that in the second half of this year, Microsoft's Commercial Cloud segment could surpass Amazon Web Services (AWS) in absolute revenue, becoming the largest public cloud platform for the first time in 10 years and firmly marking its transition from cloud laggard to cloud leader," said Brent Bracelin, Pacific Crest senior research analyst.

The firm also believes cloud spending could triple to $239 billion in five years.


Friday, June 16, 2017

Mobility Will Have New Meaning in Connected Vehicle Era

With the rise of connected cars and autonomous vehicles, we will have to learn to use the term “mobility” in a new way, as in “transportation,” not “phones.”

A study by Strategy Analytics, sponsored by Intel, predicts a new “passenger economy” generating as much as $7 trillion in annual revenues by 2050.

Consumer use of a range of mobility-as-a-service (MaaS) offerings will account for US$3.7 trillion, nearly 55 percent of all revenues. The evolution and mass adoption of MaaS by  consumers is central to the emergence of the Passenger Economy. Consumers will continue to forgo ownership as they seek out economical, self-directed personal mobility.

Revenue models might include on-demand transportation, commuter ride-sharing, mobility as a service, fleet operations, event transportation or amenity transportation, according to the report.


A fundamental assumption is that consumer and business users will be able to “order” transportation whenever needed, including for such routine uses as getting to work.

Strategy Analytics also believes automaker business models will change, with carmakers offering both on-demand and contract or subscription models that offer transportation as an amenity to their core retailing products or services.

Over time, the analysts argue, application and content revenue generated by MaaS will supplant vehicle sales as core sources of financial value creation. Auto manufacturers might also become transportation service providers themselves, as they once invested in car rental businesses. Car manufacturers used to operating fleets of vehicles for commercial rental might also operate fleets for other transportation purposes

But MaaS likely also will be a component of services and features offered by many other consumer-facing retailers and web/internet firms. Think Google, Amazon and others.

Mobility services might also become an element of the value proposition of an office building, apartment complex, university campus or home, becoming an amenity offered by guest services.

Some employees might have transportation services as a part of their compensation package. In exchange for the service, companies will maintain geo-fence limits on the “pod” while maintaining remote maintenance and service to extend the lifecycle of the investment.


Business use of MaaS will generate US$3 trillion in revenues, roughly 43 percent of total revenues. Industries like transportation and freight delivery and sales and service fleets will utilize pilotless vehicle technology to reshape their fundamental businesses and to leverage new opportunities, Strategy Analytics predicts.

AI Physical Interfaces Not as Important as Virtual

Microsoft’s dedicated AI key on some keyboards--which opens up access to Microsoft’s Copilot--now is joined by Logitech’s Signature AI mouse...